
Announcements
Announcements
Carbon emissions and air pollution linked to a commodity shipment transported by sea can now be precisely calculated with a new data-driven approach.
Read the brief below or download as a PDF.
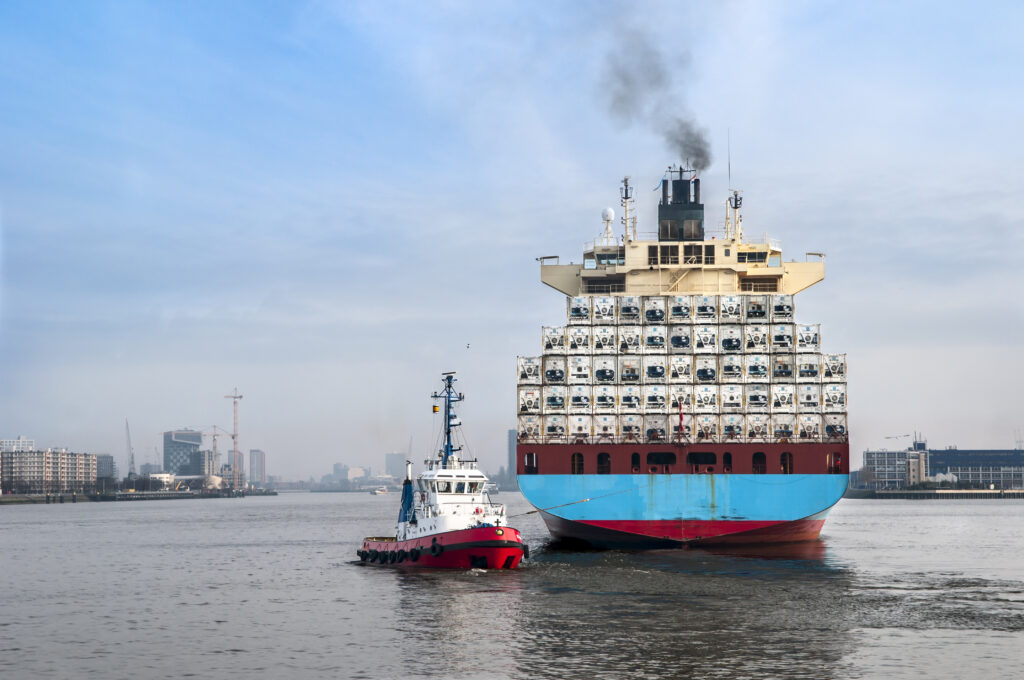
A ship carrying reefer (refrigerated) containers in the port of Rotterdam, Netherlands. Photo: Soldt / Getty Images.
Transporting commodities around the world in today’s globalized production-to-consumption systems generates large amounts of greenhouse gases and pollutants, on top of those associated with producing the commodities themselves. Maritime shipping generated an estimated 1 billion tons of greenhouse gases (CO2-equivalent) per year in 2007–2012 (IMO 2015). It was also responsible for around 15% of anthropogenic nitrogen oxides (NOx) emissions and 5–8% of anthropogenic sulphur oxides (SOx) emissions (Endresen 2003; Viana et al. 2014) – making it a major source of air pollution potentially affecting people in countries along shipping routes, as most emissions are released within 400 kilometres of shore.
Despite this, emissions from maritime shipping have been largely overlooked in discussions on climate mitigation and on sustainable consumption and production. This situation urgently needs to change, given that maritime shipping emissions are forecast to rise between 35% and 210% by 2050 (Hoen et al. 2017).
Two technical factors have helped maritime shipping emissions to stay out of the limelight: a lack of reliable data on the emissions being released, and only poor, disputed methods being available for assigning responsibility for those emissions to the different countries, traders, producers, consumers and transport companies involved. In particular, emissions per commodity type have traditionally been estimated based on traded volumes of the commodities, ignoring specificities such as the mass and bulkiness of the commodities and how they were shipped (e.g. vessel type), which can have significant influence on the scale of emissions.
Maritime shipping emissions linked to exports represented an additional 5% on top of the country’s reported CO2 emissions in 2014.
A new data-driven approach (Schim van der Loeff et al. 2018) developed in a partnership between SEI and University College London (UCL) helps to eliminate these barriers. By doing so it opens up the possibility of internationally agreed accounting – and management – of maritime shipping emissions per commodity and actor involved in the supply chain, as well as more complete environmental footprint accounts for companies, countries and consumers.
The approach builds on a method of accurately calculating emissions per vessel and per journey developed by members of the UCL team and endorsed by the International Maritime Organization (IMO). Continuously recorded automatic identification system (AIS) data on each ship’s position, bearing, draft, speed and more, gathered by satellite, is matched with data on the ship’s operational characteristics (age, engine type, fuel type etc.) in order to make frequent, precise estimates of greenhouse gas and other air pollutant emissions along its journey.
The new approach makes it possible to allocate shares of these emissions to individual commodity shipments, and thus to their exporters, importers, traders and owners. It uses newly developed methods already used in the Trase.earth supply chain transparency platform to link shipping manifests to the vessel transporting the cargo. It is thus possible to trace the complete journey of a cargo consignment from the port of export to its final destination port and allocate it a proportional share of the ship’s emissions on each leg of the journey, while also identifying the chain of ownership. This approach is a major advance for the allocation of shipping emissions, given that no previous approach has been able to exploit such fine-grained and rich data.
To demonstrate the viability and potential of the new approach, it was applied to all individual Brazilian exports in the year 2014 – around 520 million tons of cargo. The emissions of all of the world’s cargo vessels in 2014 were calculated, and then filtered for those related to Brazilian exports. Brazil was selected given its relevance to the Trase initiative and its major role in global exports of key commodities such as iron and a variety of farming products, and because comprehensive and detailed trade and shipping data was available for Brazil. Also, ahead of key IMO meetings in 2018, Brazil was one of only three parties, along with Saudi Arabia and the USA, to strongly oppose setting tough climate targets for the maritime transport sector.
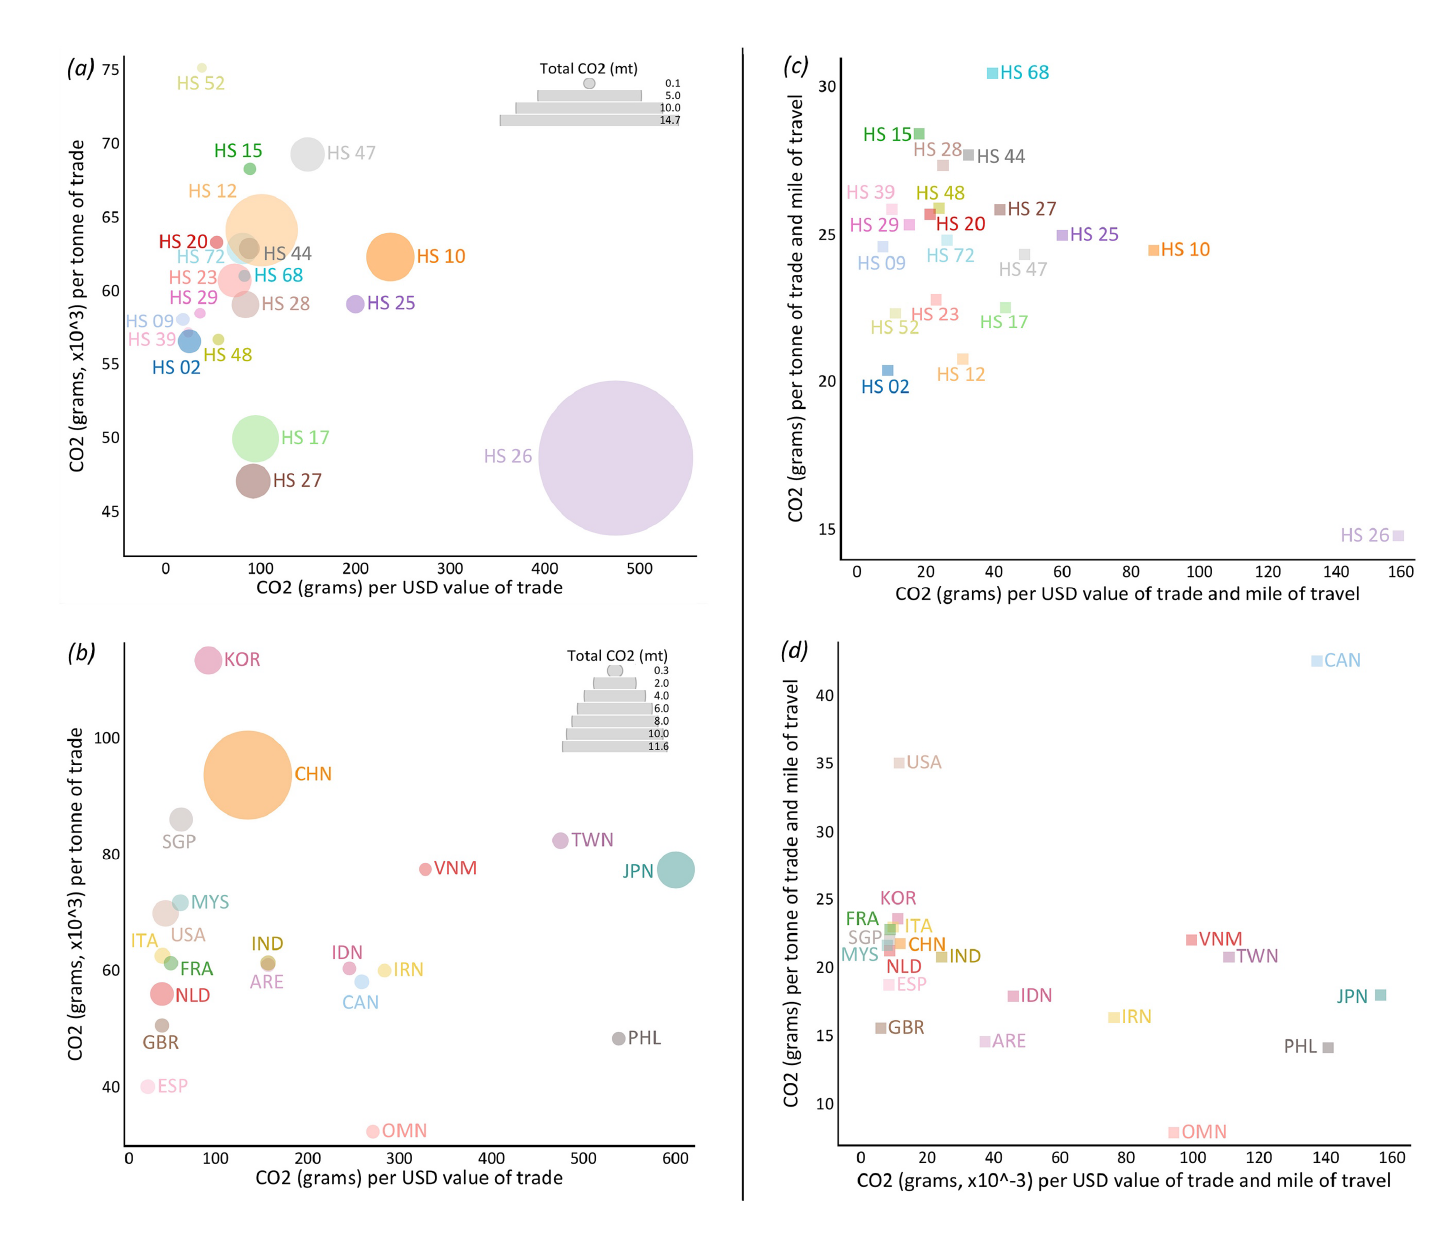
(a) shows the top 20 commodity categories (HS2), comparing the intensity of maritime shipping emissions per tonne and intensity of emissions per USD value, for Brazilian exports. Bubble sizes reflect totals of these emissions for destination countries (i.e. countries of first import). (b) Shows the top 20 importers, also comparing the intensity of emissions per tonne and intensity of emissions per USD value. (c) and (d) show the same comparisons, but taking into account miles of travel in order to focus on emissions intensity and remove the influence of distance.
Source: Schim van der Loeff et al. (2018)
The analysis covered 350 734 cargo-specific trades and 124 173 voyages moving commodities from Brazil to 112 countries. The cargo weighed 520 million metric tonnes and had a value of around US$178 billion. Commodities are described using the Harmonized Commodity Description and Coding System (HS) developed by the World Trade Organization, at the most detailed level of categorization: HS8.
Exports from Brazil in 2014 were found to be associated with 26 million tonnes of CO2 emissions. This represents an additional 5% on top of Brazil’s total CO2 emissions in 2014, as reported by the World Bank (excluding international shipping and aviation). More than half of these emissions were from exporting commodities in the HS2 category “ores, slag and ash”, the bulk of which went to China. Exports of soybeans, Brazil’s most valuable export, accounted for the second largest share: 12% of the emissions, or 3.0 million tonnes of CO2 with exports worth US$21.5 billion.
The results also highlight the importance of looking at both the weight and the value of the shipped commodities. For example, ores, slags and ash exports were found to account for a slightly smaller than average share of emissions from Brazil’s exports per tonne, but much higher than average emissions per dollar value of the exports (about 3.5 times the average). See Figure 1 for more results.
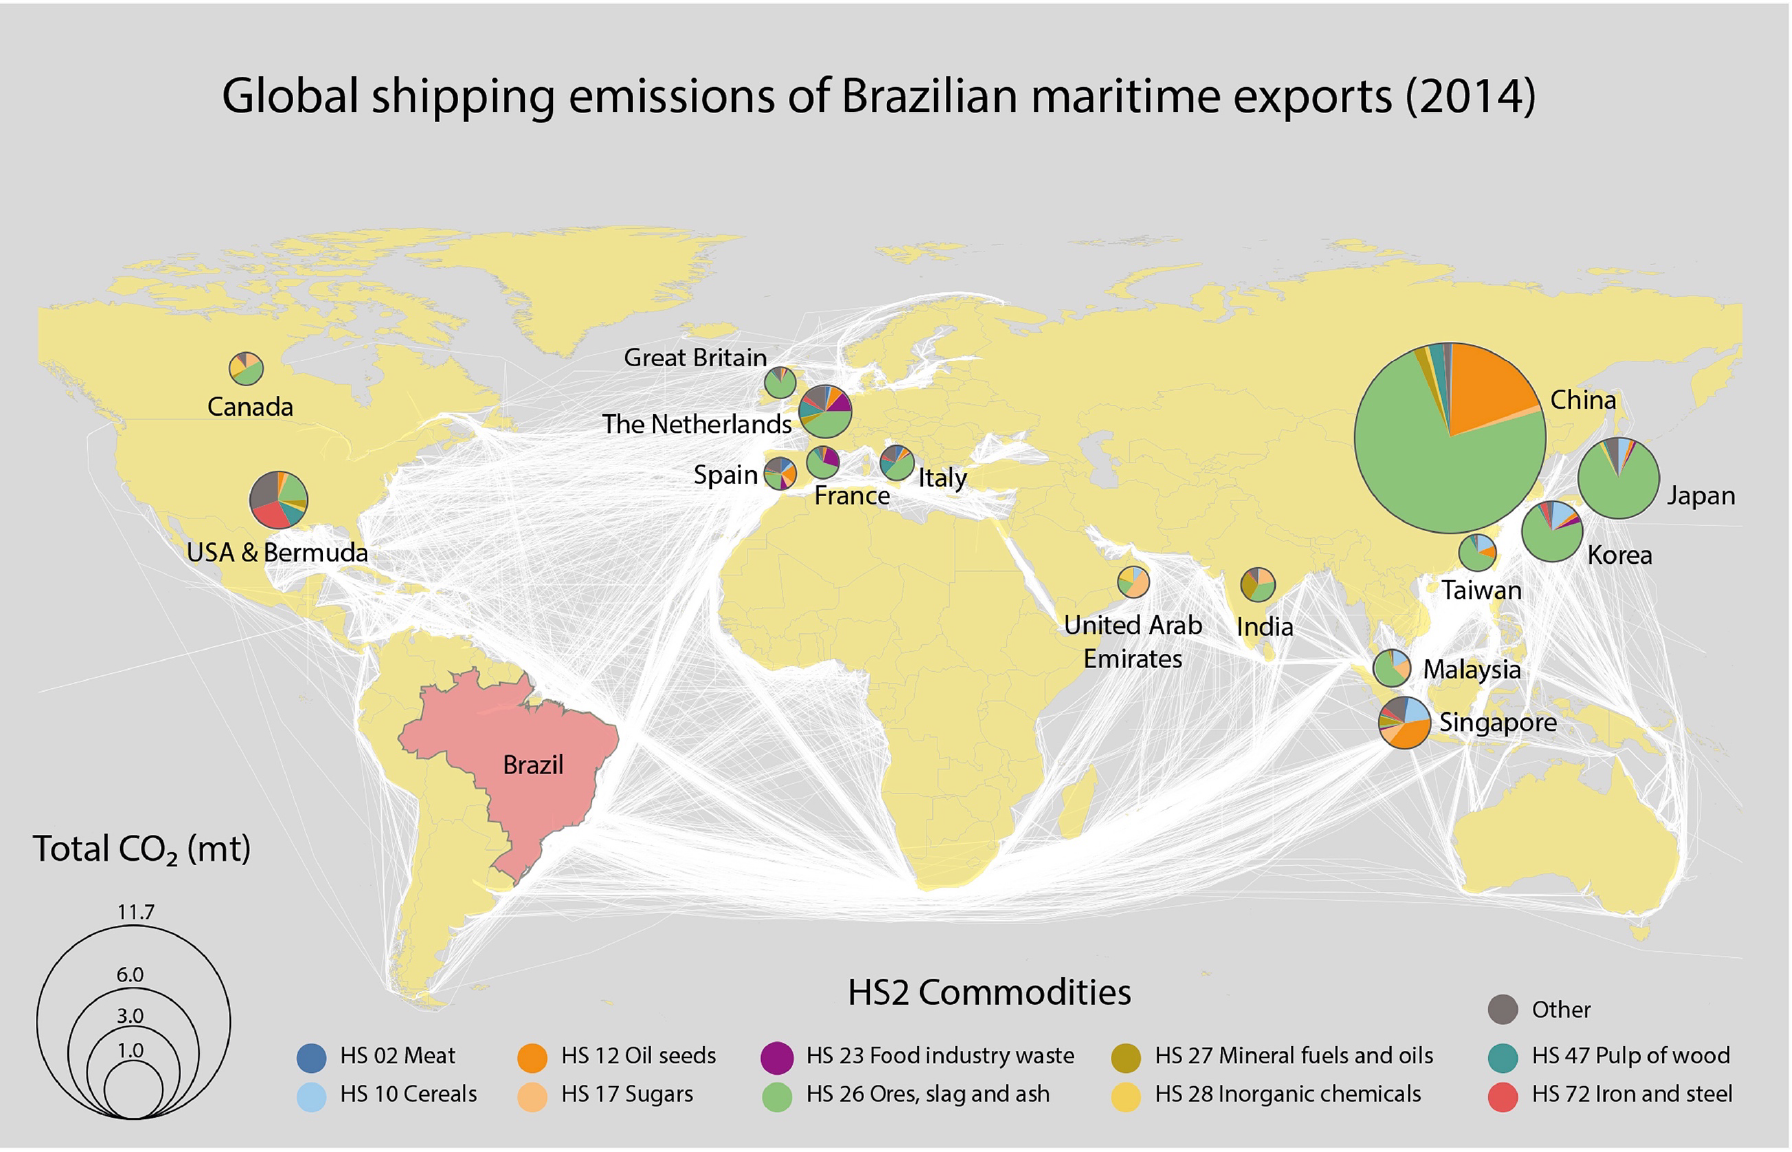
White lines show real vessel journeys. Pie charts show weight shares of the largest commodity categories imported from Brazil (at HS2 level), and are sized according to total associated shipping emissions. Actual data per commodity is more detailed (HS8 level), but is aggregated here for the sake of simplicity.
Source: Schim van der Loeff et al. (2018)
While variations in emissions per tonne of exports are obviously affected by the density of the commodity and the distance to the port of import, the new approach captures other important factors. One of these is linked to the type of ship. Container ships in particular tend to follow indirect routes, making more stops over shorter distances in order to load and unload containers, and therefore generate more emissions than if they followed direct routes. Different commodity types tend to be carried in different types of ship. In addition, certain routes might be taken by specific vessel types and sizes, and each country has a unique trading portfolio.
Exports to China accounted for almost half (45.6%) of the CO2 emissions associated with Brazilian exports (albeit less than 20% of the total value of Brazilian exports), with Japan and South Korea accounting for the next largest shares. Figure 1 also shows how allocation of emissions to different importers and commodity types is affected when distance travelled is taken into account.
Figure 2 shows combinations of importer country and commodity associated with large shares of emissions. The top country-commodity pairings for total emissions are China’s imports of iron ores and soy, then imports of iron ore to Japan, South Korea and the Netherlands.
When scaled up to cover larger areas of the world, the new approach has the potential to offer reliable global accounting of trade-related maritime transport emissions, in close to real time, as the required data is usually available within a matter of weeks.
The availability of such accounts removes any significant technological obstacles to including maritime shipping – a major source of greenhouse gas emissions – in international negotiations on climate change mitigation. While the question of who should be responsible for curbing the emissions – exporters, importers, vessel flag states, beneficial owners etc. – will still need to be settled, this approach has significant potential to inform the discussions and accelerate reaching a sound consensus and standards. The approach could also decisevely improve carbon reporting by countries and companies, informing their own mitigation targets.
The transparency and detailed information that can be provided can also help to increase efficiency in the shipping industry, through measures such as route and operational optimization.
It can also improve footprinting and consumption-based indicators, such as those developed by the PRINCE project in Sweden, which attempt to estimate where extraterritorial emissions occur and what commodities they are related to. The approach is already being used to improve lifecycle assessment (LCA) for soy supply chains originating in the global South. Preliminary results indicate that current LCA approaches tend to greatly oversimplify the large variability of shipping emissions by not covering the role of different vessel efficiencies or the real journeys vessels make.
In a next phase, SEI aims to engage with stakeholders on how to facilitate the uptake of this approach, and to discuss its applications and possibilities for informing mitigation policy – including equitable assessment of the responsibility of countries and companies for maritime shipping emissions.
This brief is based on Schim van der Loeff, W., Godar, J. and Prakash, V. (2018). A spatially explicit data-driven approach to calculating commodity-specific shipping emissions per vessel. Journal of Cleaner Production. DOI: 10.1016/j.jclepro.2018.09.053.
The research contributes to the PRINCE project, supported by the Swedish Environmental Protection Agency and the Swedish Agency for Marine and Water Management (Environmental Research Appropriation 1:5). SEI’s contribution was supported by the Swedish International Development Cooperation Agency (Sida) through the SEI Initiative on Producer to Consumer Sustainability (P2CS), and by a grant from the Gordon and Betty Moore Foundation under the Trase initiative.
Journal article / This article presents a new method for accurately calculating GHG emissions from marine cargo shipping, and attributing them to countries, vessels and products.
Journal article / How do reforestation gains stack up against deforestation embedded in consumption?
Project / PRINCE is a cross-disciplinary project aiming to develop a sound and repeatable methodology to monitor the environmental impacts of Swedish consumption.
Design and development by Soapbox.