Editor’s choice
Editor’s choice
SEI's Consumption Compass 2.0 provides detailed, high-resolution data on household consumption-based emissions at fine geographical scales across Sweden.
Consumption Compass 2.0 is a web-based tool developed by SEI to track and visualize household consumption-based greenhouse gas emissions across Sweden. It provides detailed emissions data for 107 indirect consumption categories (COICOP), plus two categories of direct emissions from transport and energy use, downscaled to nearly 6000 Demographic Statistical Areas (DeSOs).
The dataset integrates national statistics with local data on lifestyle, income and consumption patterns using a hybrid top-down and bottom-up approach. Emissions are broken down into indirect emissions (from the production and supply of goods and services) and direct emissions (from household fuel use and private vehicle travel), capturing impacts across transport, food, housing energy and goods.
Covering the years 2019–2023, the tool features interactive visualizations including maps, time series and comparative graphs that illustrate differences in emissions across regions, years and consumption areas. It also includes a scenario function for modelling potential emission reductions through behavioural changes – such as reduced air travel or lower meat consumption – through to 2050.
Figure showing the top consumption categories contributing to individual greenhouse gas emissions in Sweden. Transport and food dominate emissions, making up over half of the total per capita emissions.
For local and regional governments, the Consumption Compass 2.0 provides a concrete basis for integrating consumption-based emissions into climate action plans. It helps identify which household behaviors and consumption areas drive emissions locally, supporting targeted interventions. The scenario function allows planners to model pathways to 2050 climate goals, informing priority setting and stakeholder engagement.
Researchers benefit from the tool’s high-resolution, consumption-based emissions estimates across time and geography. The model supports studies on climate inequality, regional policy impacts and behavioural interventions. It also provides a transparent, replicable framework for further exploration into sustainable lifestyles and indirect emissions.
Consumption Compass 2.0 estimates household consumption-based emissions using a hybrid approach, combining national statistics with local lifestyle and behavioural data. Key sources include:
A pie chart illustrates the contribution of each data source:
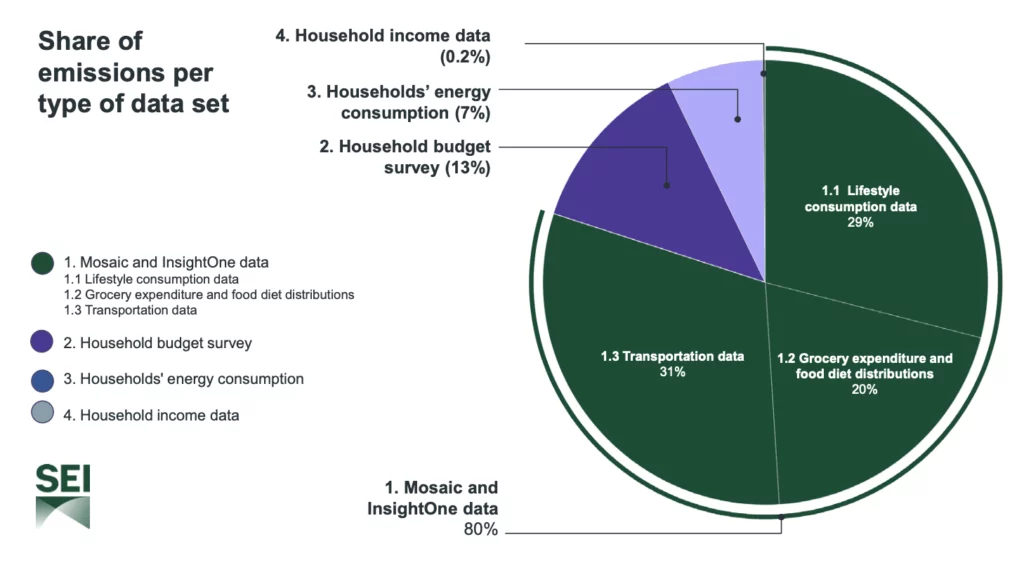
The majority of emissions are estimated using Mosaic and InsightOne data (80%), including lifestyle, food, and transport data. Household budget survey data contributes 13%, followed by household energy consumption data (7%) and income-based estimates (0.2%).
Municipalities are the primary target audience for the tool, as they play a central role in promoting sustainable consumption patterns and emissions reductions. The tool is also designed to support engagement with the general public, while regional authorities, researchers and civil society organizations represent additional key user groups.
By combining granular data with intuitive visual outputs, Consumption Compass 2.0 enables users to better understand and act on the climate impact of consumption.
Axelsson, K., Walke, P., Broekhoff, D., Yu, A. C.-W., & André, K. (2025). Consumption Compass 2.0 (Version 05/2025) [Computer software]. SEI. https://konsumtionskompassen.se/
SEI’s Consumption Compass and its data is protected under the Creative Commons license: CC BY-NC-ND 4.0. © Stockholm Environment Institute 2022.
Consumption Compass 2.0 was developed by SEI with financial support from Formas – the Swedish Research Council for Sustainable Development. The tool was created in close collaboration with Kalmar Municipality and Umeå Municipality. Key data support was provided by InsightOne, and web integration by Cloudberry.
Project / Konsumtionskompassen är ett projekt samt ett innovativt verktyg som tydliggör utsläppen av växthusgaser från konsumtion i Sverige.
Project / Understanding local government drivers for sustainable consumption (UNLOCK) investigates how incentive structures shape sustainable consumption behaviours.

Project / In 2018, SEI was contracted by Umeå municipality to develop a tool for calculating Umeå's inhabitants' consumption-based climate impact.