Editor’s choice
Editor’s choice
The overall aim of this paper is to develop and test a data-driven and streamlined framework for identifying and mapping localized hotspots and analyzing trends in single and compound hydroclimatic hazards, thereby addressing the need for region-specific multi-hazard assessments with locally available data and validated inputs.
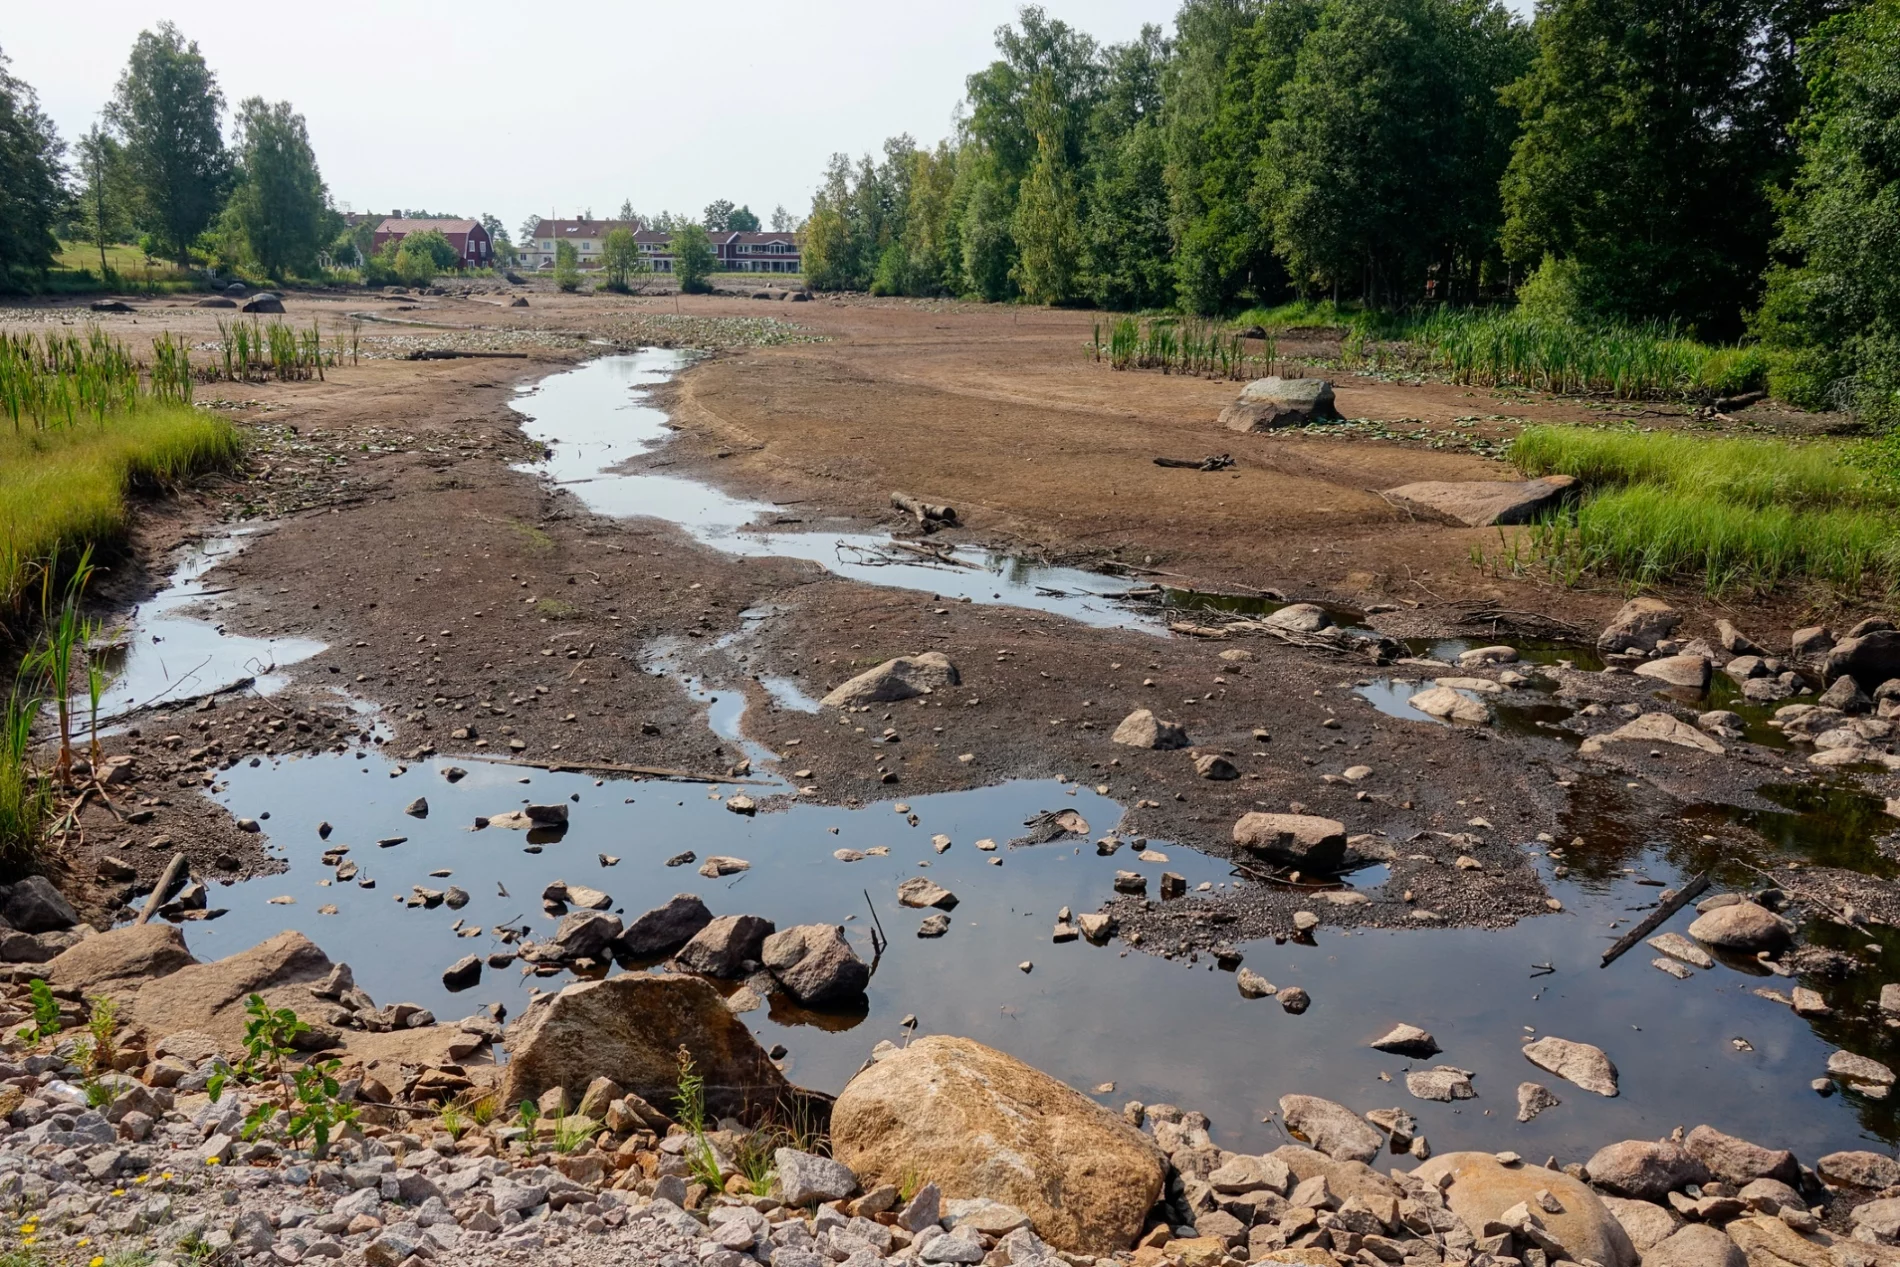
A dried up pond in a community in the summer, Hovmantorp, Småland, Sweden.
Photo: Schon / Getty Images
In this paper, the authors present a framework to aid in the selection of optimal environmental indicators for detecting and mapping extreme events and analyzing trends in heatwaves, meteorological and hydrological droughts, foods, and their compound occurrence. The framework uses temperature, precipitation, river discharge, and derived climate indices to characterize the spatial distribution of hazard intensity, frequency, duration, co-occurrence, and dependence.
The relevant climate indices applied are Standardized Precipitation Index, Standardized Precipitation and Evapotranspiration Index (SPEI), Standardized Streamflow Index, heatwave indices based on fixed (HWIS) and anomalous temperatures (HWIE), and Daily Flood Index (DFI). The authors selected suitable environmental indicators and corresponding thresholds for each hazard based on estimated extreme event detection performance using receiver operating characteristics (ROC), area under curve (AUC), and accuracy, which is defined as the proportion of correct detections. They assessed compound hazard dependence using a Likelihood Multiplication Factor (LMF).
The researchers tested the framework for the case of Sweden, using daily data for the period 1922–2021. The ROC results showed that HWIS, SPEI12 and DFI are suitable indices for representing heatwaves, droughts, and foods, respectively (AUC > 0.83). Application of these indices revealed increasing heatwave and food occurrence in large areas of Sweden, but no significant change trend for droughts. Hotspots with LMF > 1, mostly concentrated in northern Sweden from June to August, indicated that compound drought-heatwave and drought-food events are positively correlated in those areas, which can exacerbate their impacts.
The novel framework presented in this paper adds to existing hydroclimatic hazard research by (1) using local data and historical records of extremes to validate indicator-based hazard hotspots, (2) evaluating compound hazards at regional scale, (3) being transferable and streamlined, (4) attaining satisfactory performance for indicator-based hazard detection as demonstrated by the ROC method, and (5) being generalizable to various hazard types.
Project / CrisAct aims to provide a comprehensive science-based framework to monitor and manage hydroclimatically driven natural hazard crisis and disaster responses.
Project / The project examines how exposure and vulnerability to water hazards impact infrastructures and populations in Sweden.
Journal article / This article investigates machine learning models for predicting heatwaves, aiding early warnings and mitigation planning.
Journal article / This journal comment details the importance of having quantifiable, standardized, multihazard early warning systems to address heatwaves.
Feature / SEI researchers call for proactive strategies to manage Sweden’s interconnected climate risks and their cascading effects.