Editor’s choice
Editor’s choice
In Sweden, the average individual carbon footprint masks complexities of social and economic conditions — from food choice to access to electricity and different modes of travel. National policies to minimize carbon footprints should be translated differently considering the needs and fairness of societal groups.
Here, we delve into variations across municipalities and identify the socio-economic profiles of the groups most at risk of falling behind in the country’s low-carbon transition.
An average individual in Sweden generates about 6.2 metric tons of greenhouse gas emissions every year. This number needs to be cut down to no more than 1 ton per capita in order to stay within 1.5°C warming. Photo: Martin Magnemyr / Unsplash.
Sweden leads the charge in defining consumption-based emissions targets at a national scale to align with its net-zero climate goal. On average, an individual in Sweden generated about 6.2 metric tons of greenhouse gas emissions in 2019. To keep pace with the ambitious 1.5°C climate goal, this must be drastically reduced to less than 1 ton per capita.
However, averages can deceive. They paint a broad picture, neglecting the diversity of individual situations. Our research exposes significant variations in this narrative. We find individuals’ carbon footprints ranging from a whopping 17 tons per person to 3 tons annually across postcode areas. Income appears to be a key variable, with the wealthier producing the highest emissions. This variety in footprints implies that while some people may have to make significant lifestyle adjustments, others, especially those with already lower footprints, might be disadvantaged by a swift low-carbon transition if they fail to keep pace.
To gain a better understanding of these variations, we broke down national-level footprint data across consumer groups, postcodes and municipalities. By doing this, we could scrutinize differences across diverse demographics and regions.
The population at risk of poverty or social exclusion (AROPE) is defined as “the sum of persons who are either at risk of poverty, or severely materially and socially deprived or living in a household with a very low work intensity” and calculated based on data from Eurostat.
Our analysis segmented the Swedish population into four distinct groups based on their population density and their risk of poverty or social exclusion. The findings suggest that urban residents, with a low poverty and social exclusion risk, generate emissions of about 6.5 tons per capita. They constitute one-fifth of the population and contribute to 19% of total emissions. On the other hand, rural residents, at greater risk of poverty and social exclusion, represent a larger share – two-fifths of the population and total emissions.
Sustainable consumption is not necessarily an outcome of conscious eco-friendly decisions. Often, it is the result of necessity or traditional lifestyle choices. A deeper look into the data reveals that those with lower footprints face a higher risk of poverty and social exclusion. They are more reliant on personal vehicles and usually reside in less densely populated, more rural areas. These individuals typically spend less on flights, restaurants and hotels, dedicating a larger share of their income to running private vehicles and food.
By scrutinizing the consumption habits and social circumstances of different groups, we can create detailed sociodemographic profiles. For instance, among those living in rural areas and at a high risk of poverty and social exclusion, there are three groups that have the lowest consumption footprints.
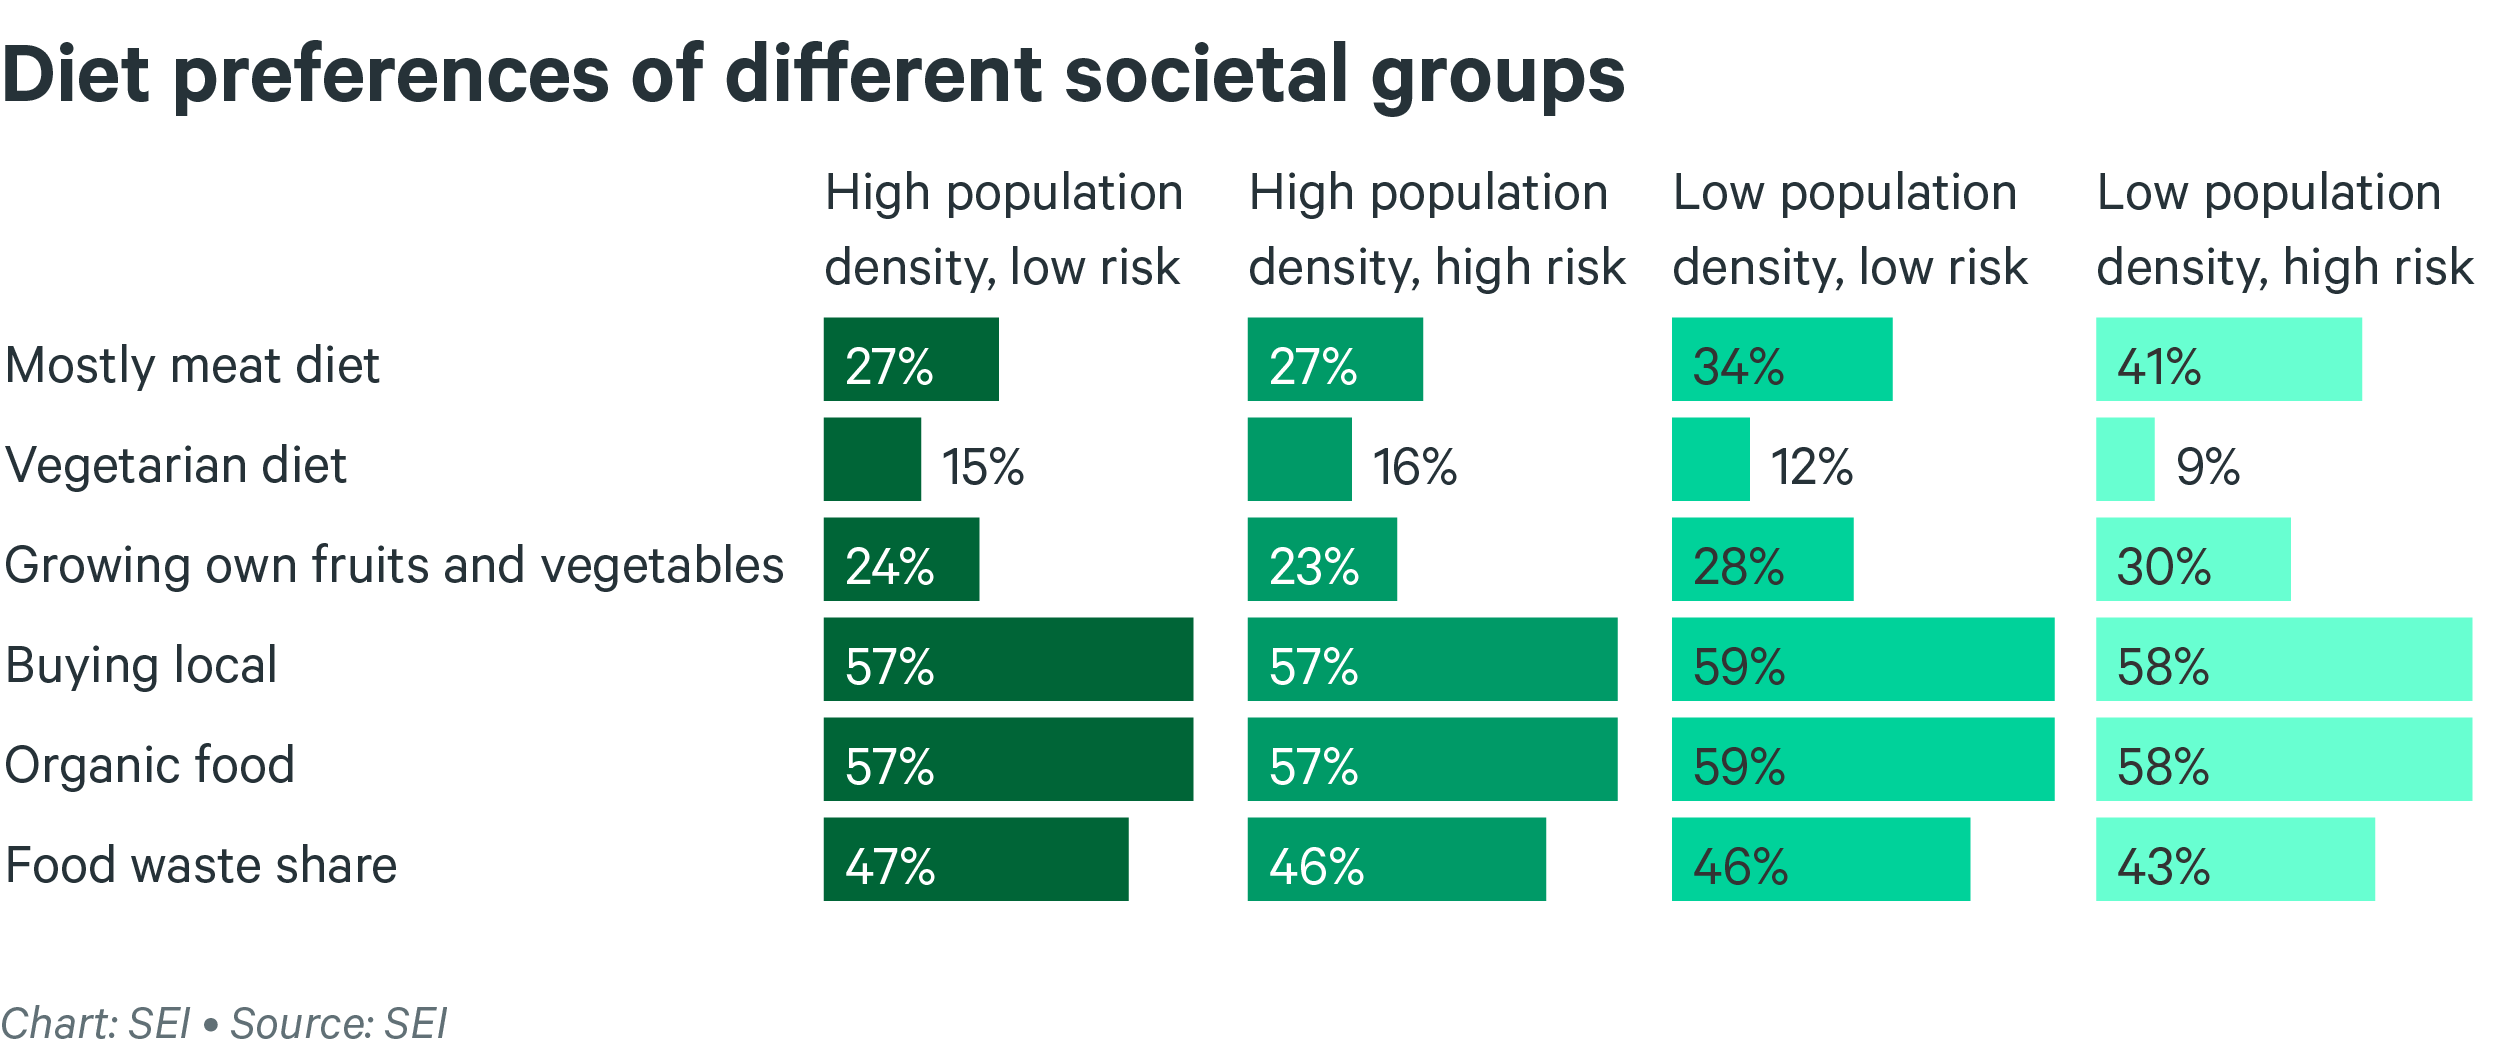
Sweden’s meat consumption saw a substantial rise of 66% in 2018 compared to 1960. People on average consumed 32 kg of meat per person annually, which contributed to 40% of total meat consumption, and 24 kg of beef, accounting for another 30%. Our research explores the food consumption habits of our defined groups and finds that a higher percentage of rural residents with high social exclusion risk follow a predominantly meat-based diet and account for the lowest percentage of people practicing vegetarian diets. In contrast, this group performs better than their urban counterparts in adopting sustainable practices such as growing their own produce.
Urban dwellers with a lower social risk have less dependence on cars and utilize active and public transport more readily. They have access to more than triple the length of cycle paths compared to people living in rural areas and at high risk of poverty or social exclusion.
The disparity in access to public transport is also stark. Rural residents most at risk have to travel nearly four times (2.09 km) the distance to access public transport compared to their urban counterparts (0.46 km).
In terms of accessing essential services such as retail, school and healthcare, rural residents at most risk have to travel at least 2.5 times more than urban dwellers. The longer distances and limited alternative transport modes force rural population groups to rely more on cars than their urban peers, reflected in the higher number of cars per capita and higher emissions from personal vehicles. Therefore, this group may be disproportionately impacted by a transition away from fossil-fuel based vehicles. They might not reap the full benefits of investments in public transport, active travel infrastructure or the reduced pollution from curtailed urban traffic.
![]()
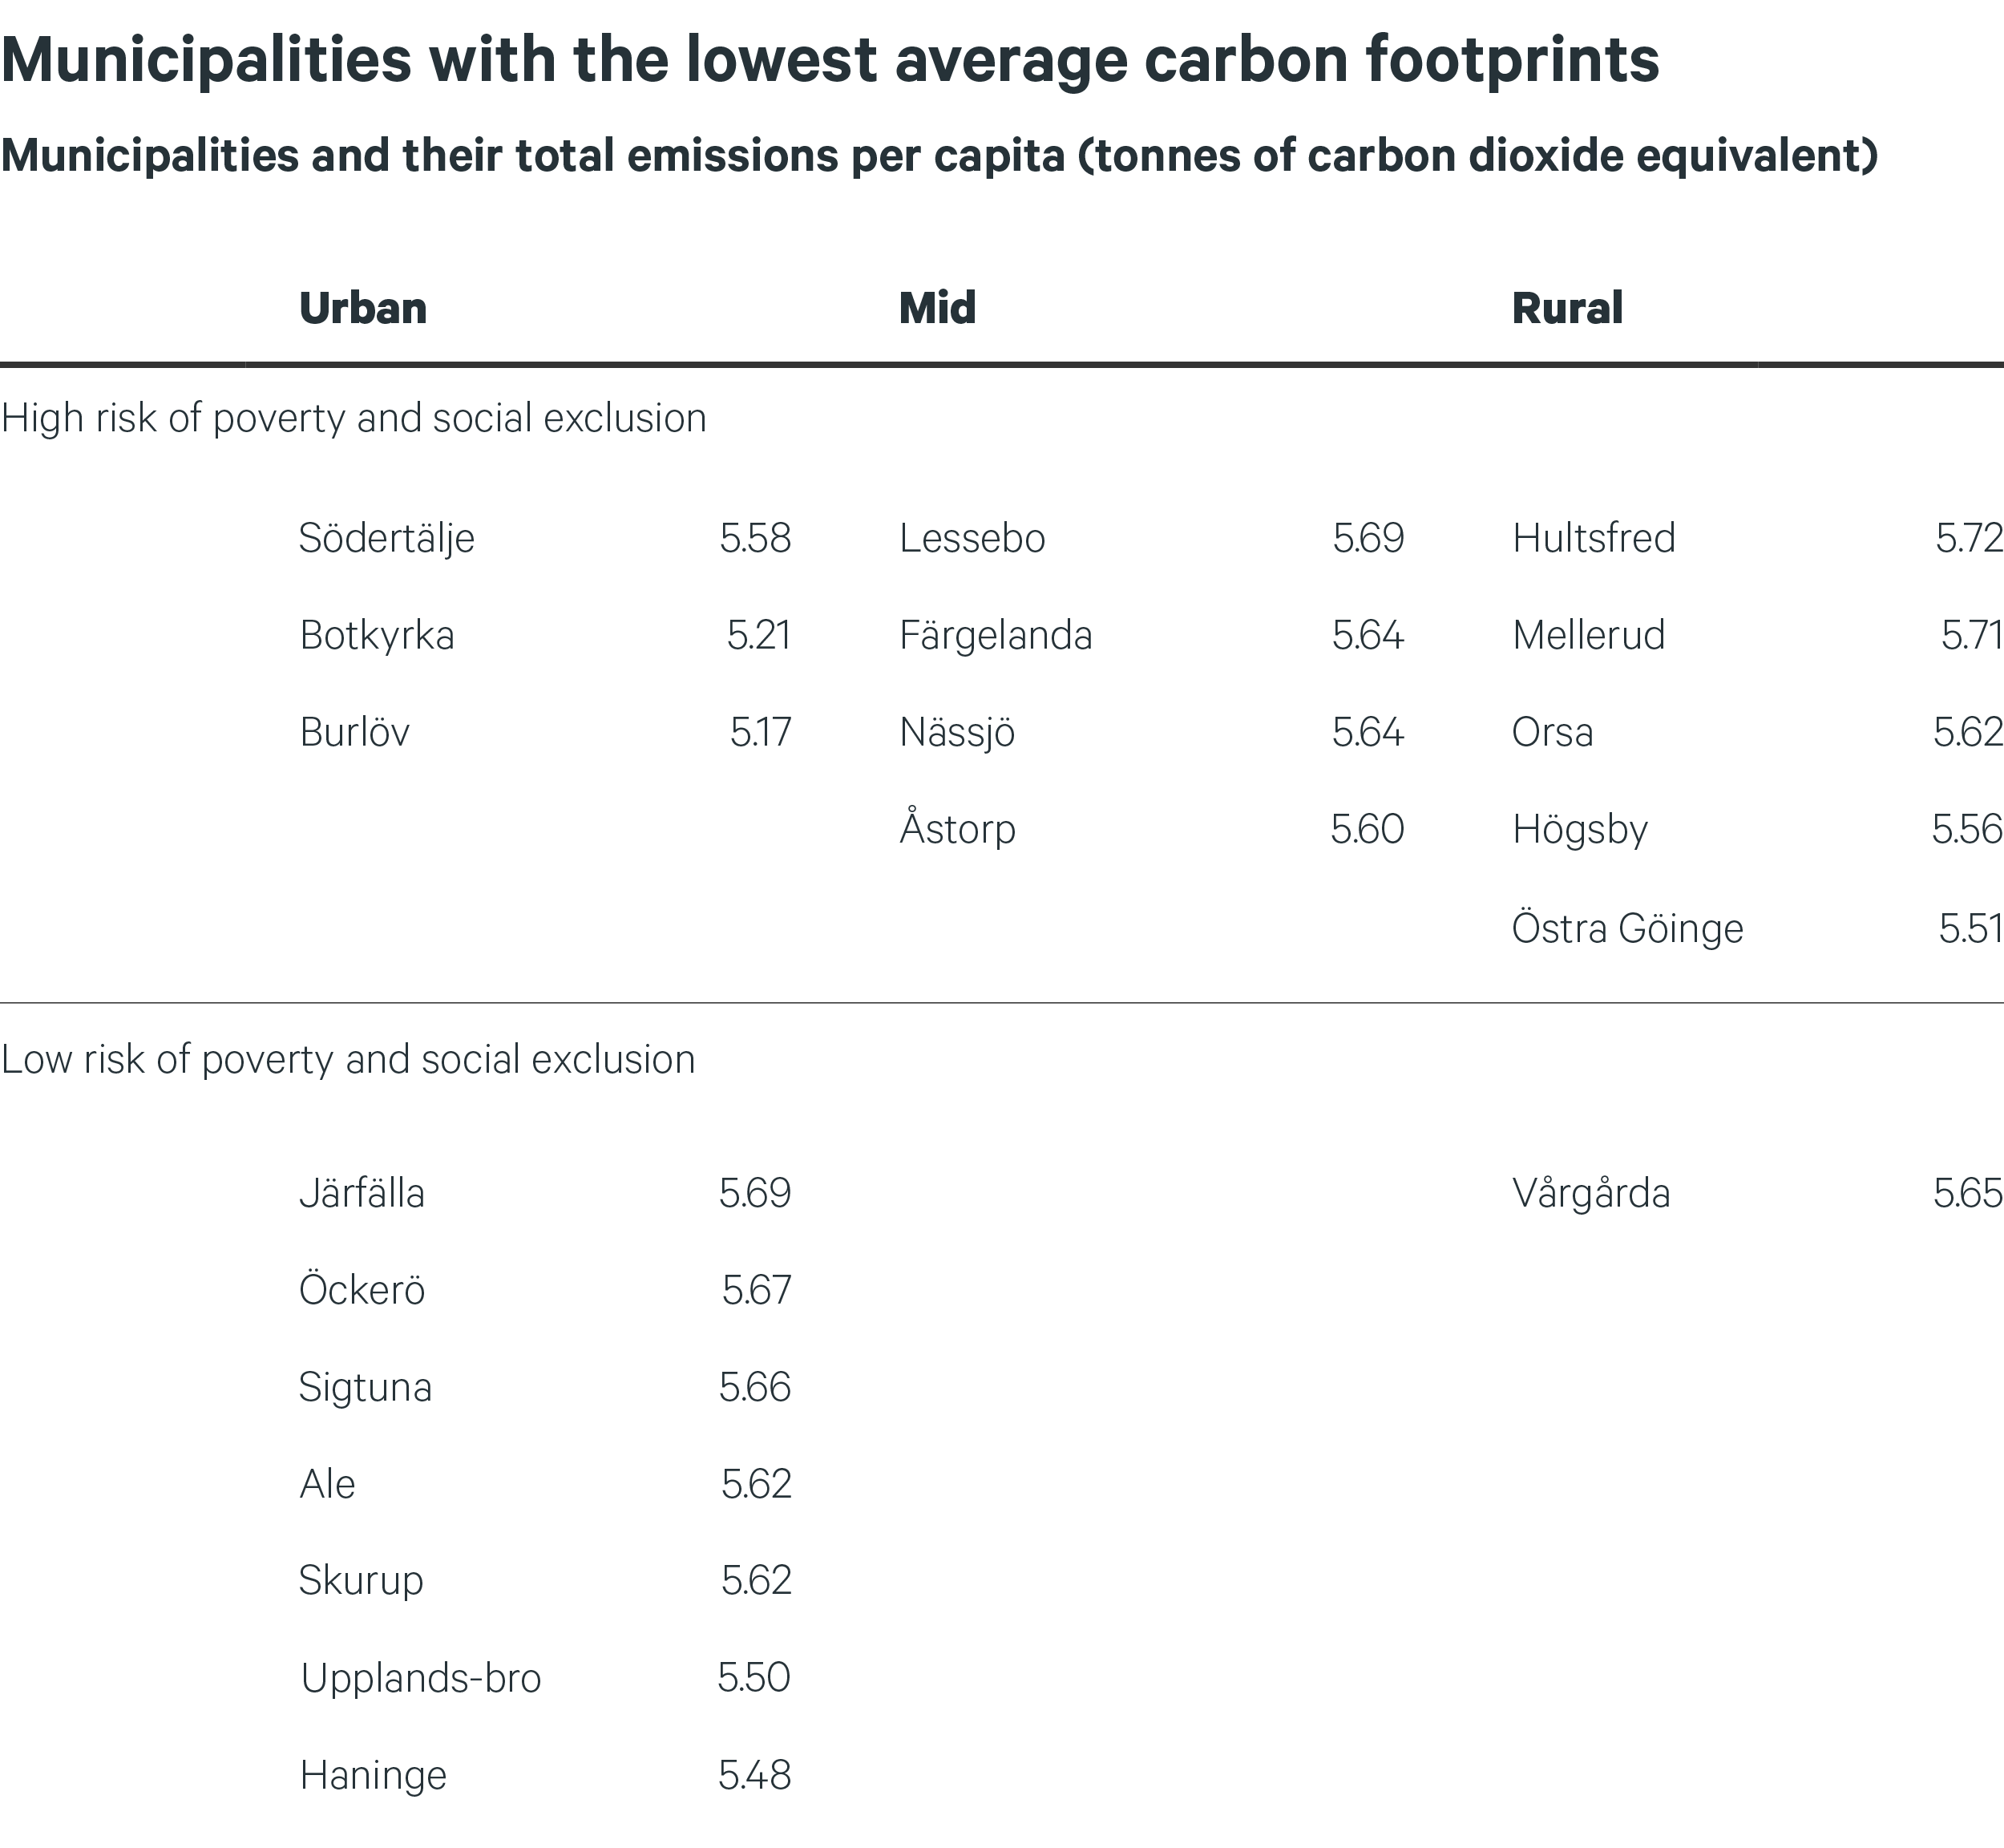
A geographical analysis of our groups can help pinpoint municipalities with the lowest and highest carbon footprints. Out of the 20 municipalities with the lowest average carbon footprints (between 3.7 and 4 tons CO2e per person exclusive of public procurement and investments), 12 are semi-rural or rural with a higher risk of poverty and social exclusion. Of these municipalities, 4 have nearly a quarter of the population at high risk of poverty or social exclusion.
For instance, Färgelanda and Högsby have air travel footprints less than half of the average Swede but slightly higher car emissions. Conversely, Sigtuna showcases higher air travel emissions due to the presence of a major airport, Stockholm Arlanda, but lower than average car emissions. Such contrasts highlight the role of location and access to services in determining carbon footprints.

The conversation surrounding carbon footprints primarily focuses on the urgent need to reduce emissions, a necessity that applies to all of Sweden’s residents. However, the transition to a low-emission society must be just and fair. Policies should take into account groups with already lower footprints and higher poverty risks. This will ensure that they are not disadvantaged by emission-reducing measures and that they can benefit from potential co-benefits, such as healthier air quality.
Two essential steps could help ensure a just transition:
Even the lowest per capita emissions in Sweden currently stand at 3 tons – three times the 2050 target of 1 ton. It is crucial to create a narrative where low-carbon lifestyles are a societal aspiration, encouraging high emitters to reduce emission and averting a high-footprint development pathway for those with lower emissions.
The responsibility for shifting to a low-emission society should not fall solely on individuals. Public and private sectors must create an environment that enables and provides sustainable alternatives as the default choice. For instance, our data suggests that those with lower carbon footprints may be more dependent on higher carbon forms of transport, with less possibility to make a switch to lower carbon options. Improving access to public transport or cycling infrastructure for those with lower carbon footprints could help reduce the use of cars.
The choices citizens face when it comes to food purchases are daunting, with cost, taste and carbon footprint to consider, not to mention the environmental impacts of food production such as water use or land degradation. Our food systems need significant reforms to make sustainable options universally accessible. While shifts in dietary habits, such as reductions in meat consumption, are essential, left to their own devices, historical trends point in the opposite direction.
Policies must therefore support and enable these changes while assisting the most vulnerable groups. Fairness-focused policies could best support the most vulnerable and at-risk groups in society, which comprise 40% of the total population and together account for 41% total consumption emissions.
In sum, our study underscores the need for a nuanced approach to reducing carbon footprints, prioritizing a just transition that shares benefits equitably, avoids replicating existing disadvantages, and enhances wellbeing and lifestyles.
Read more about the Consumption Compass on emissions at municipal and postcode level: Konsumtionskompassen (in Swedish)
Project / This project seeks to understand tensions in future consumption patterns in Sweden to ensure a fair transition to a fossil-free welfare society.
Journal article / This paper investigates the demand-side aspects of a just low-carbon transition, with a focus on the transport and food sectors in Sweden.
Perspective / Our project shines a spotlight on the potential of passenger cars, public transport and active mobility to help reduce Sweden’s transport emissions equitably.
Perspective / On World Food Day, we look at Sweden's just transition towards net-zero carbon emissions by diving into three key categories: footprints, health, and fairness.