Editor’s choice
Editor’s choice
Commodity Footprints is a free interactive dashboard that includes the ability to visualize the data underpinning the Global Environmental Impacts of Consumption indicator (GEIC indicator). The GEIC indicator can be used by companies, governmental agencies and countries to analyze global consumption activities.
The Global Environmental Impacts of Consumption indicator was developed by SEI York’s Sustainable Consumption and Production (SCP) group and JNCC (the UK Joint Nature Conservation Committee) to enhance access to a new indicator set for monitoring the overseas impacts of UK consumption. Importantly, however, it can also be used much more widely for global analysis of production and consumption activities.
SEI York’s Chris West, Simon Croft, Jonathan Green and Amy Molotoks and SEI partner Global Canopy developer Bernardo Loureiro explain how policymakers, NGOs and others can use the dashboard to support their work.
The first annual update of the data occurred today.
The Commodity Footprints dashboard uses data generated from a version of SEI York’s Input-Output Trade Analysis (IOTA) modelling framework, which has been developed over a number of years and has recently been improved to extend its coverage. IOTA continues to be developed across a number of research projects, including within SEI’s Trase programme.
An indicator is a communication tool that summarizes data on a complex issue. Environmental indicators are important for monitoring the status and trends of biological diversity and signaling key issues to be addressed through policy or management interventions. When used to assess national, regional or global trends, they build a bridge between the fields of policymaking and science.
Why do we need data on the global environmental impacts of consumption and production?
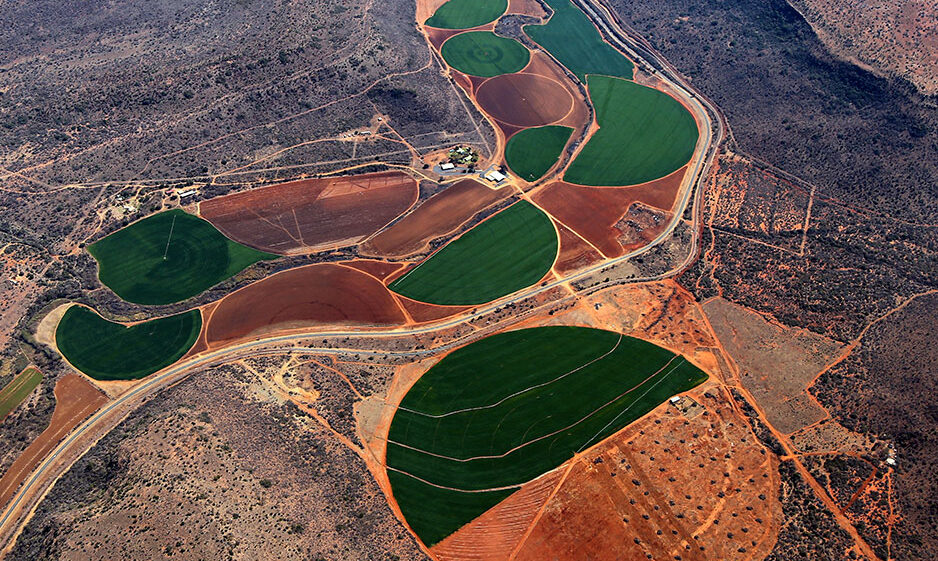
Chris West: Many of the things we buy, whether goods or services, are dependent on economies and production systems overseas. All production systems involve the input of resources and result in environmental pressures or impacts. To meet our environmental commitments, such as those linked to the Sustainable Development Goals or the UN Framework Convention on Climate Change, we need to think not just about our domestic environmental impact, but also the pressures that our consumption activities impose on the environment around the world. To do this we need detailed information on where we are sourcing materials from, and the impacts of producing them. However, the complexity of trade and international supply chains means that this is far from trivial.
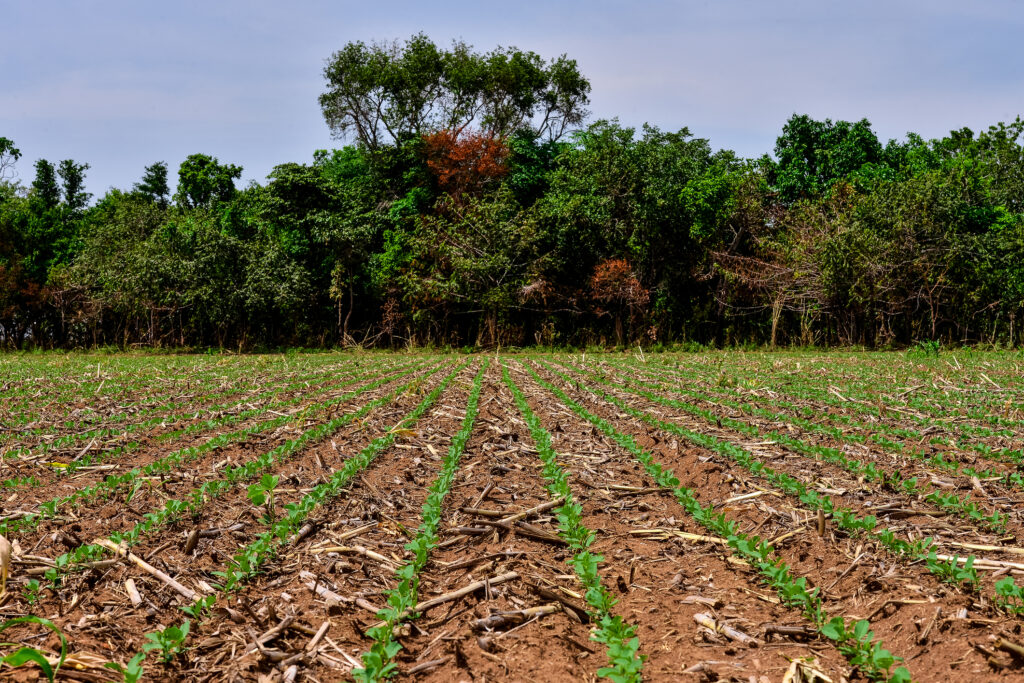
Soybean plantation and Amazon forest, Mato Grosso, Brazil. Photo: Lucas Ninno / Moment / Getty Images.
What information is available through the dashboard?
Chris West: The dashboard presents the results of the IOTA modelling framework for the period 2005 to 2017. The dashboard covers the production and consumption of agricultural commodities and their impacts, and we provide the option to view this information on a per-commodity basis (e.g soybeans or bananas). We include a range of environmental indicators, including for water use and scarcity-weighted water use, land use, and a couple of metrics for biodiversity risk.
The main indicator, however, is linked to tropical and subtropical deforestation, where we make use of Florence Pendrill’s excellent global data. The dashboard makes all of this information accessible to users via a combination of maps (so that one can explore the location of potential impacts) and charts to show which production or consumption locations, and commodities, are responsible for the highest impacts and how this varies over time.
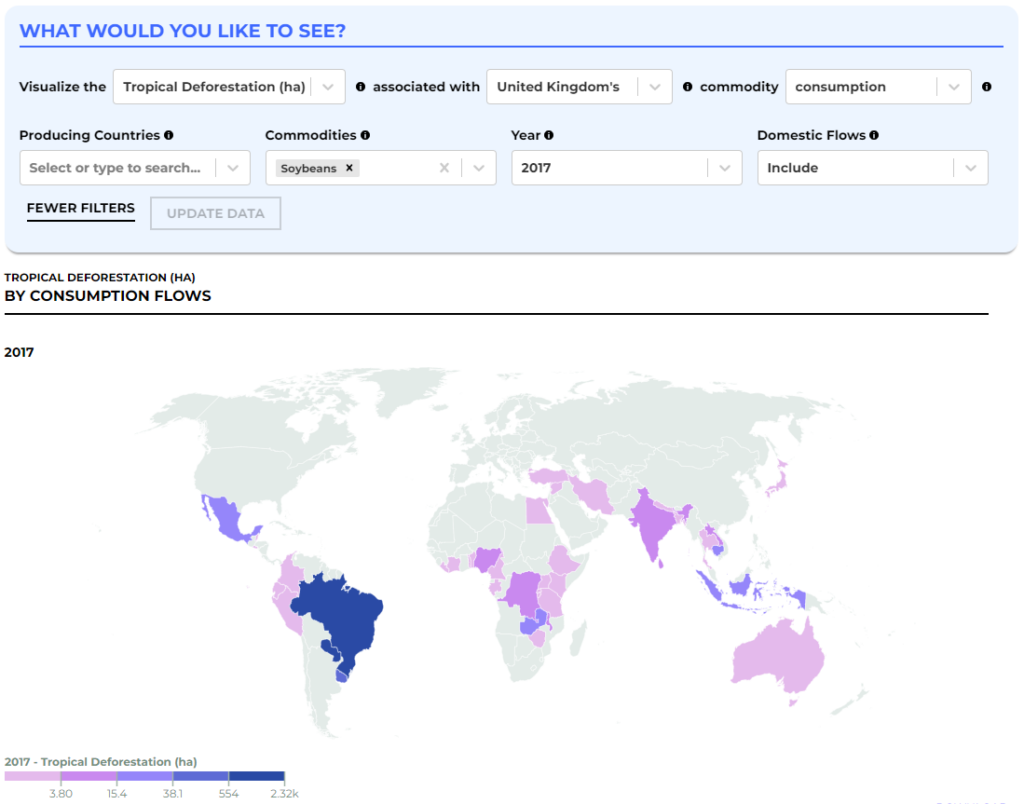
Map showing the global impact the UK’s soybean consumption had on tropical deforestation in 2017.
Graphic: commodityfootprints.earth. Graphic: commodityfootprints.earth.
Why did you create this dashboard and who is it for?
Jonathan Green: Our primary motivation behind the dashboard is to bring our research to policymakers, NGOs and others, to better equip them with the information they need to tackle environmental problems. This helps them to set priorities for research and interventions, and monitor trends in the environmental impacts of consumption. We carefully curated key visual comparisons that allow dashboard users to understand the information they are seeing in the context of other countries or other commodities.

Chart comparing tropical deforestation resulting from UK consumption compared with that of other countries. Graphic: commodityfootprints.earth.
What does the dashboard offer that is new?
Simon Croft: Whilst the IOTA framework has been under development for a number of years, this is the first time that we have been able to make the data it provides accessible to the public. The dashboard has been designed to be easy to use so people can get quick answers about risk “hotspots”. In the past, requests for this information would have been provided by us mainly via extensive data tables. We have tried to bring the data to life in intuitive ways, with visuals showing trends and comparisons.
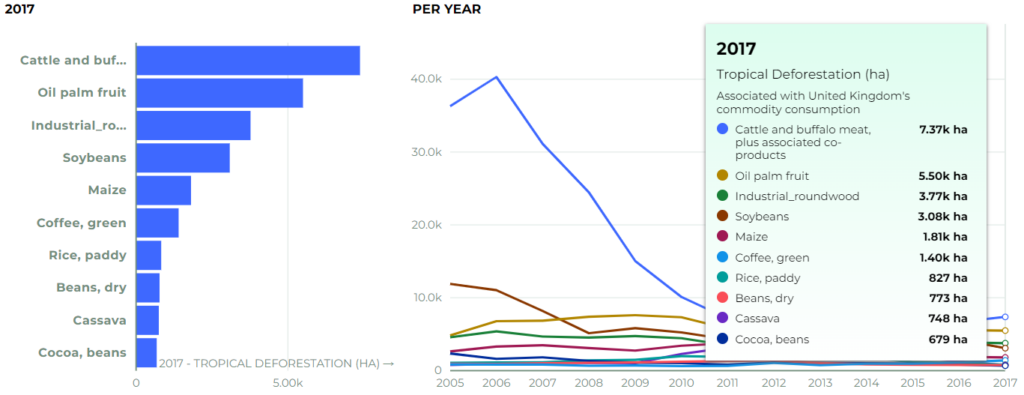
Graphics comparing tropical deforestation resulting from UK consumption of a variety of commodities.
Graphic: commodityfootprints.earth.
In addition to the dashboard providing a portal into our data, the underpinning data itself represents an advance. Firstly, even though it remains at an experimental stage, it’s the first time the UK has had a “formal” indicator for its overseas impacts linked to consumption (read the JNCC report on the underlying experimental statistic). Secondly, the IOTA framework (from which the indicator and metrics are derived) has been extended and advanced to provide this new information. We continue to make iterative improvements to the framework that will be reflected on the dashboard in the future. We have commodity coverage across all primary agricultural commodities from within the UN FAO’s production and trade (FAOSTAT) database, as well as an increased range of environmental indicators. This means that we can now identify the environmental impacts associated with the production of a specific commodity in each producer country and map those all the way through the supply chain to the consumer country.
How does the data presented in the dashboard compare to other assessments of the environmental impacts of trade and consumption?
Amy Molotoks: Data on the global environmental impacts of consumption and production will differ according to both the methods used to compile and harmonize statistics and the underpinning datasets used. Environmental indicator results vary according to the environmental metrics used and the model employed, due to differences in geographic and temporal resolution, time lags, and country or sectoral representation. While aligned on where key deforestation risks originate, different assessments show different findings in terms of the absolute size of the UKs tropical and subtropical deforestation footprint, and the top commodities contributing to this (read this paper written by Molotoks and West for more information). We are working across the research community and have recently appointed a PhD student to investigate the differences between modelling approaches, how they affect results and what value the different perspectives offer.
How can the dashboard help policymakers?
Chris West: A key focus of the dashboard is to understand and communicate the UK’s responsibility for addressing tropical and subtropical deforestation risk. Indeed, the indicator was developed in response to the UK’s 25 Year Environment Plan and recommendations from the UK Global Resource Initiative and has also been recently called for by the UK’s Environmental Audit Select Committee. To date, the indicator has been used to inform the prioritization of commodities linked to the incoming UK due diligence legislation for UK due diligence legislation for deforestation-risk commodities, along with SEI’s response to the associated public consultation. The indicator has also been put forward by the UK Government as a suggested indicator under the upcoming Convention on Biological Diversity framework .We are also working with other governments throughout Europe to integrate consumption-based measures of deforestation risk.
Ultimately, the dashboard is best placed to provide information on the risk hotspots that consuming countries might be exposed to. Additional analysis is required to really understand the extent to which a country’s supply is implicated in environmental harms and – importantly – how policymakers might respond.
Who else may find the dashboard useful?
Jonathan Green: Although designed with and for policymakers, we think the dashboard is something that others can use too. It is already used by academics, while funding bodies could use it to assess research priorities and NGOs might find it useful as evidence, to put pressure on governments to act on their most damaging supply chains. All the data are available to download and we hope that this will spur further research projects and insights.
How do the production and consumption metrics work?
Simon Croft: The IOTA framework utilizes a combination of “physical” data (such as crop mass and land area) from various datasets, and a financial model, known as a multiregional input-output (MRIO) model. The former provide commodity specific information on production and bilateral trade. The financial MRIO model enables us to estimate the flows of goods and services via economic sectors, all the way along the supply chain, from the point of production to the point of final consumption. This “hybrid” model makes it possible to join the country- and commodity-specific physical datasets with the superior “reach” of the financial MRIO to provide a means of linking commodity-specific production to end-user consumption.
The production and consumption metrics used in the dashboard utilize these same underlying data outputs, simply looking at them from different perspectives. The production perspective considers a point of production, and looks at which countries and regions are ultimately sourcing the produce. Conversely, the consumption perspective looks back up the supply chains to see what is being consumed, and where the products originate from.
Is any additional functionality planned for the dashboard in future?
Bernardo Loureiro: Research in this area is ongoing, so we want to improve the dashboard and add additional indicators in the future. However, we also want to provide clear and manageable amounts of information. To help get the balance right, and ensure that it continues to meet evolving stakeholder needs, we have co-designed the dashboard with the JNCC, and will continue to incorporate considerations of user experience. We anticipate adding more comparison functionality so it is easier for users to assess the relative impacts across different countries.
Amy Molotoks: We are also looking at the added value of incorporating additional biodiversity metrics for assessing the impact of trade on biodiversity. Currently, we assess predicted species loss and species richness, but we may also add threatened and endemic species richness. This will help us understand whether adding additional complexity improves the identification of risk hotspots linked to trade activities.
Chris West: We’re also exploring how the data from the dashboard and UK indicator can be improved and used alongside other datasets to inform decision-making across both the public and private sector. In particular, we have started work to support the development of the UK Soy Manifesto, a commitment by over 30 companies in the UK to reduce deforestation risk linked to the UK’s use of soy. Tools like the IOTA framework provide a concrete evidence base to inform where the risks are located and how they might be responded to. We’ll continue to work directly with supply chain stakeholders going forward to advise them on steps that can be taken to reduce overseas impacts and improve the sustainability of production landscapes.
Dashboard development was supported by the UK Department for Environment, Food & Rural Affairs, the UK Research and Innovation’s Global Challenges Research Fund (GCRF) through the GCRF Trade Hub (project ES/S008160/1) and Trase.
Bernardo Loureiro
Ylva Rylander, Communications Officer, SEI Headquarters
Frances Dixon, Communication Specialist, SEI York
Project / Assessing trade in agricultural commodities e.g. palm oil and soybean production in environments at risk.
Tool / Input-Output Trade Analysis (IOTA) is an environmental footprinting tool linking data on commodity production with inter-industry buying and selling.
Tool / Trase enables governments, companies and others to address the environmental impacts of supply chains.
Project / CAScading Climate risks: towards ADaptive and resilient European Societies – an EU H2020 project assessing the interconnected impacts of climate change.
SEI report / This report describes the methodologies of a new experimental statistic that will act as an indicator of the global environmental impacts of UK consumption.
Journal article / Consumer countries and blocs are developing laws to tackle deforestation linked to commodity imports but they are insufficient to address this global issue.
Other publication / Whether trade is "good" or "bad" for our societies and the environment has been a topic of ongoing debate. This brief is a simple overview of the costs.